Reports
Reports (main menu) brings together on one screen the progress and workload of your projects: key indicators, a comparison between projects or a breakdown by phase, who is logging hours and how things evolve over time. You filter by project and by date range, and it updates immediately, with no “Apply” button.
It is visible to a PM (for their own projects) and to an “entire organisation” member, for example a CEO (for all the projects of the active organisation), always read-only. A Consultant/Developer who opens the route sees the notice “You don't have access to this section: it's only for PMs and organisation members.” and no data; for their daily work they have My work.
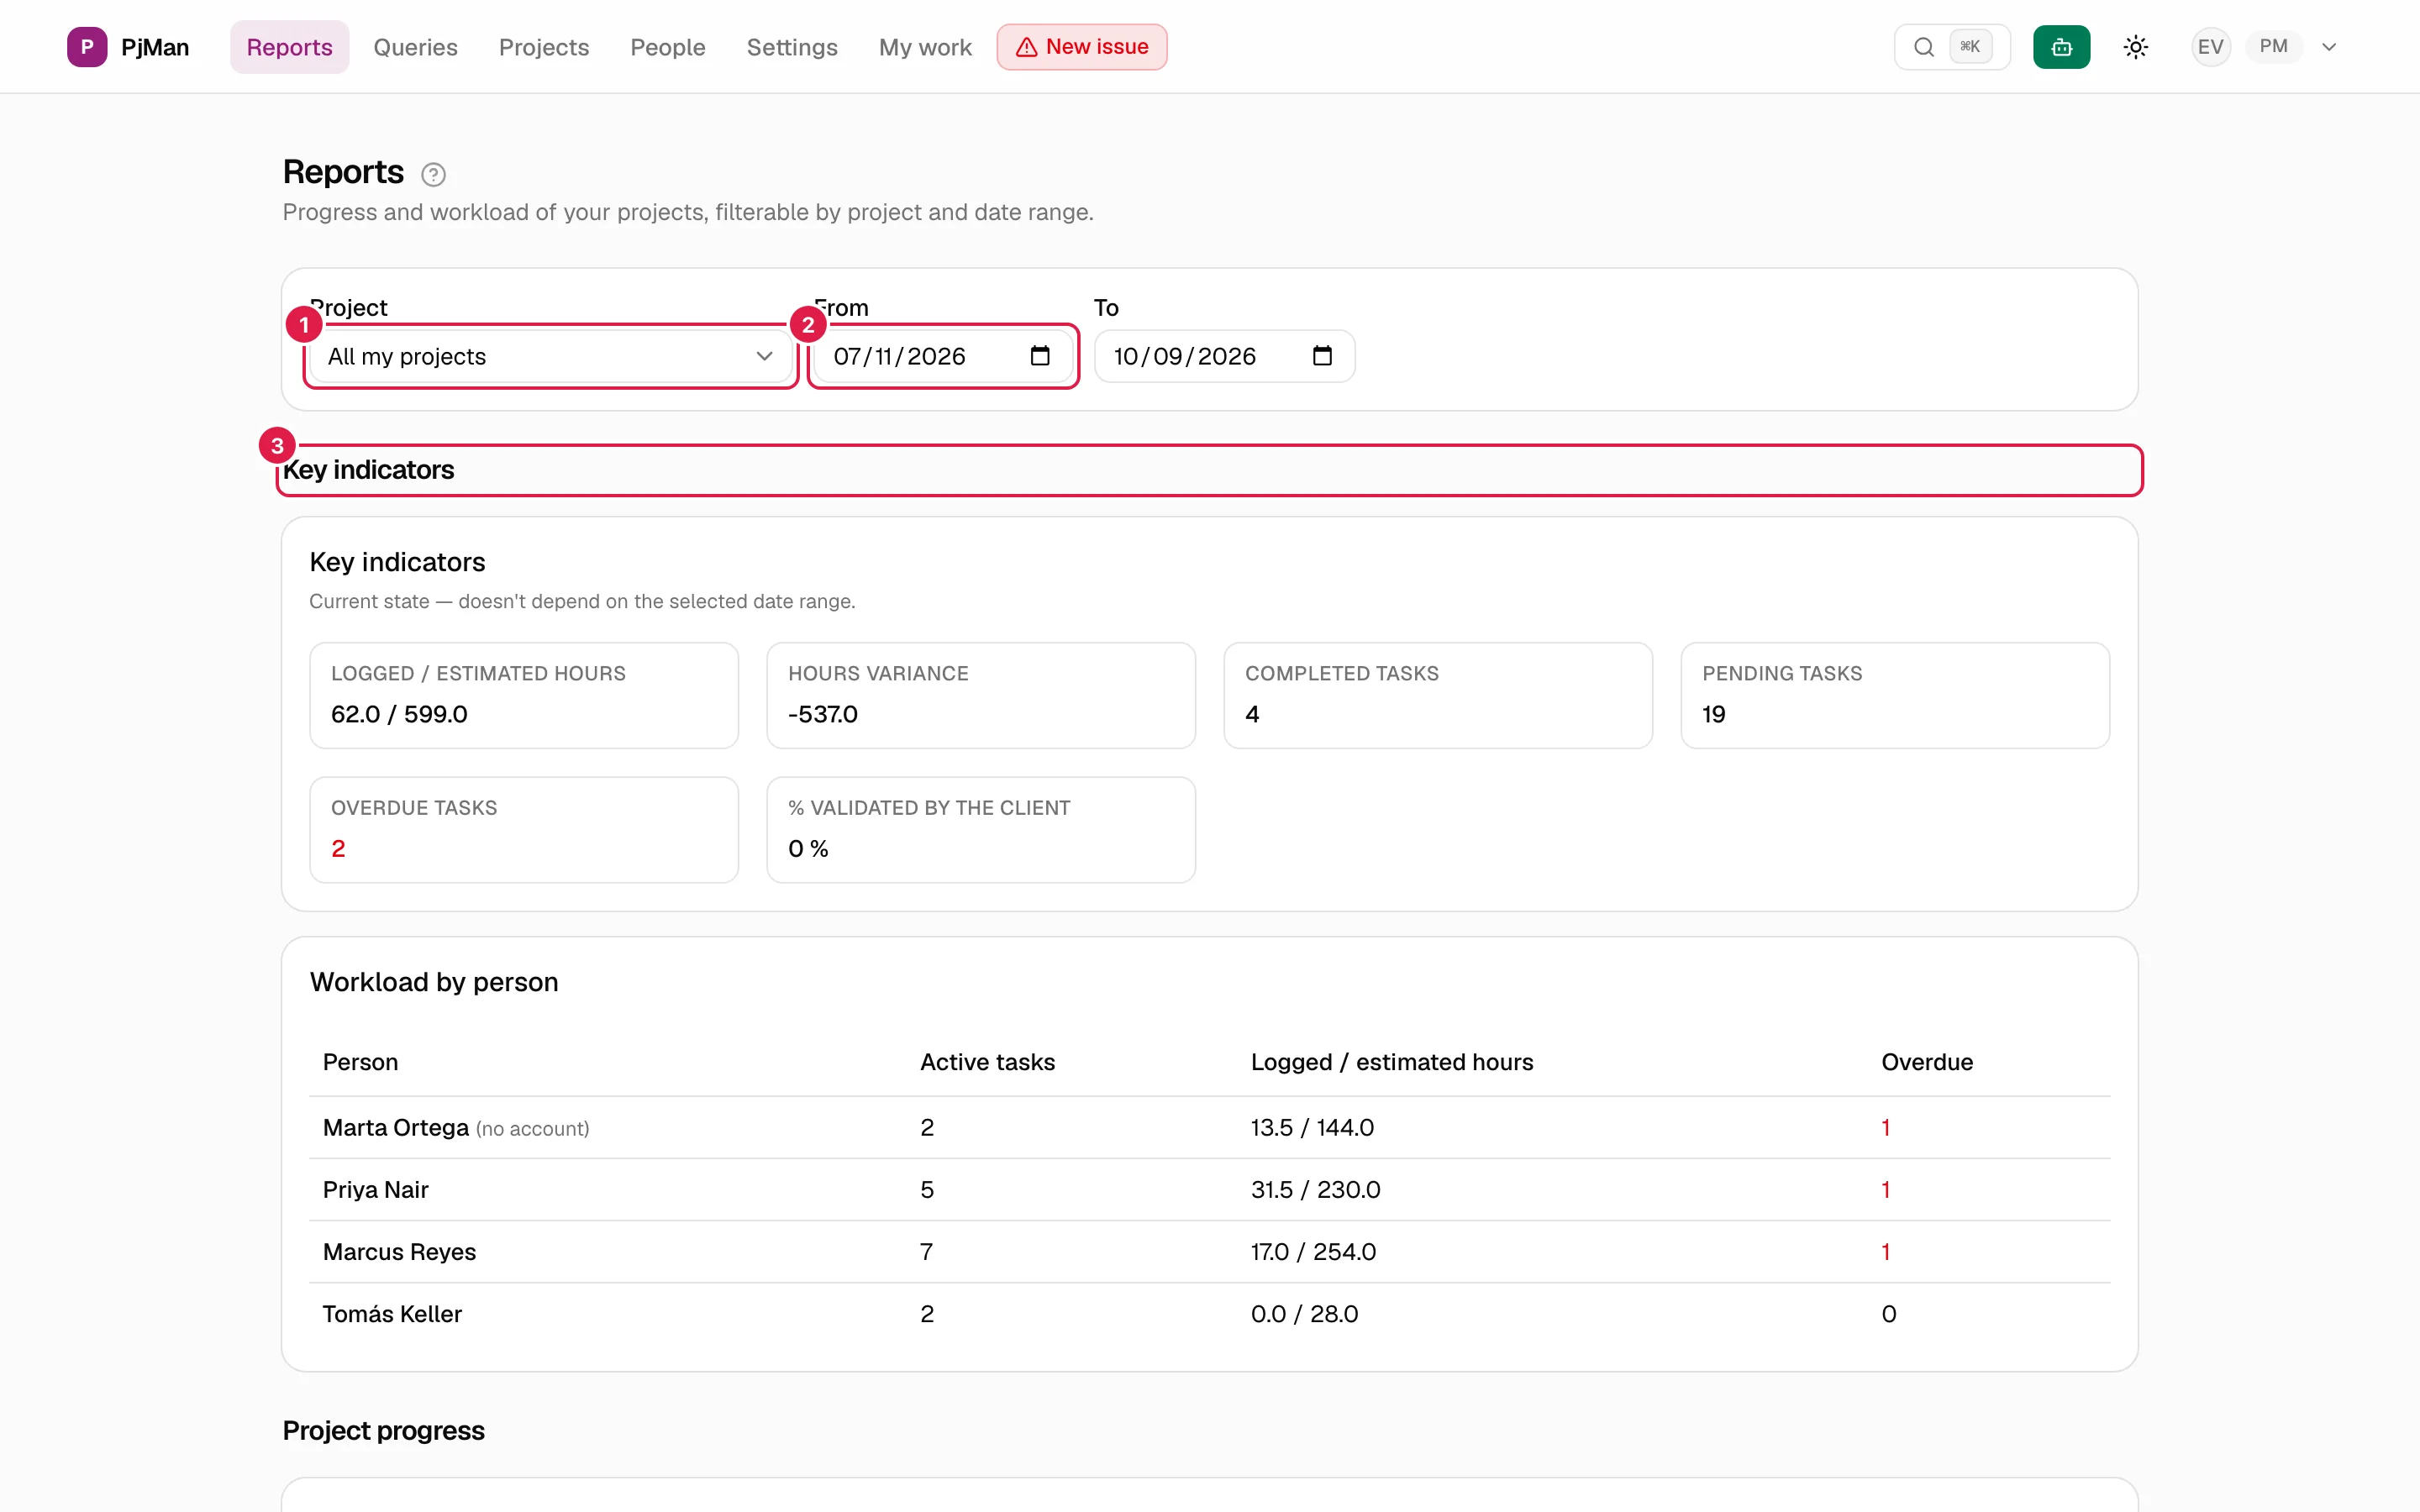
- Project: all projects or a specific one.
- From / To: the date range of the charts.
- Key indicators for the chosen scope.
Filters: project and date range
- Project. The first option changes its name depending on who is looking: All my projects for a PM and All organisation projects for an “entire organisation” member. Choosing a specific project changes the progress block (see below) and filters everything else.
- From and To. By default, the last 90 days up to today. If you type a date that does not exist, or set a “From” later than the “To”, the screen does not warn you: it silently goes back to the default range.
- What depends on the range and what does not. The current state blocks (key indicators, workload by person, progress and project comparison) do not depend on the dates, and the screen reminds you with the note “Current state — doesn't depend on the selected date range.”. Only the charts use the range.
If there are no projects in the scope yet, instead of data you see “There are no projects yet” and, for a PM, the invitation to create the first one.
Project progress
The block changes depending on the project filter:
- With “all”: the Project comparison table, sorted from lowest to highest progress (so whatever is going worst comes first). For each project: progress, and logged hours against the hour budget; in red if the project has already exceeded its budget, and “no budget” if it has none.
- With a specific project: the Total project progress (the same indicator as in the project summary) and, below it, the breakdown by phases and sub-phases, with their progress and hours.
Progress is calculated as always: weighted by the estimated hours of the tasks (task → phase → project).
Key indicators
Six indicators for the chosen scope, always showing today's state:
| Indicator | What it counts |
|---|---|
| Logged / estimated hours | Sum of the time entries against the estimated hours of the tasks. |
| Hours variance | Logged minus estimated. Positive = you have gone over. |
| Completed tasks | Those in a status marked as final. |
| Pending tasks | Those not in a final status and not overdue. |
| Overdue tasks | Those not in a final status whose end date has already passed. |
| % validated by the client | Of the completed tasks, how many have client validation ticked; with no completed tasks, no percentage is shown. |
“Completed” is the task's final status (see Tasks), not the “Validated by the client” checkbox: they are different things, which is why the last indicator exists.
Workload by person
The Workload by person table lists, for each person with work in the scope: their active tasks, their logged hours against estimated and how many are overdue. People without an account carry the label “(no account)”. If nobody has logged hours yet, you see “Nobody has logged hours in this scope yet.”.
Charts by date range
All of them use the From/To range and, if the scope is a project, only that project:
- Project progress over time: the average progress across the projects that have data on that day. Daily progress tracking started recently, so earlier days have no data (“No data”).
- Logged hours over time: with three scales, Daily, Weekly and Monthly.
- Created tasks in the range.
- Completed tasks: counts only those completed since this tracking was switched on; earlier ones do not appear here even though the “Completed tasks” indicator does include them (the screen itself warns about this).
- Logged hours by person.
Each chart shows its own message when there is no data in the range (“No hours logged in the selected date range.”, etc.).
Issues
A block of its own with the same scope:
- Issue key indicators: open, closed, average resolution time, logged hours and unassigned.
- Distribution: by project when you look at all of them, by phase when you look at one (with “No linked phase” for those that have none).
- Issues created and resolved in the range. Resolved issues have the same history limitation as completed tasks: only since tracking began.
More about them in Issues.
What Reports does not do
For a written summary for the client, the assistant can prepare the status report (see Status, forecast, portfolio, client report and meetings).
Who can do what
| PM | “Entire organisation” member | Consultant/Developer | |
|---|---|---|---|
| See Reports | Yes, for their projects | Yes, for the whole active organisation | No |
| Change project and dates | Yes | Yes | — |
| Edit data from here | No (read-only) | No | — |
Related topics
Updated 2026-10-08